Ultrasonic Borehole Imaging
Ultrasonic borehole imaging has become an essential technique to evaluate the tool’s measurement and provide key geological information on formation characteristics for logging while drilling (LWD) tools.
My main work duties at Halliburton are designing and implementing algorithms for an ultrasonic caliper and imager, which can generate high-resolution borehole caliper images and amplitude (impedance) images in different drilling scenarios (horizontal/ vertical wells, drilling speed, tool size, borehole size, mud weight, w/o stabilizer).
Drilling Tool
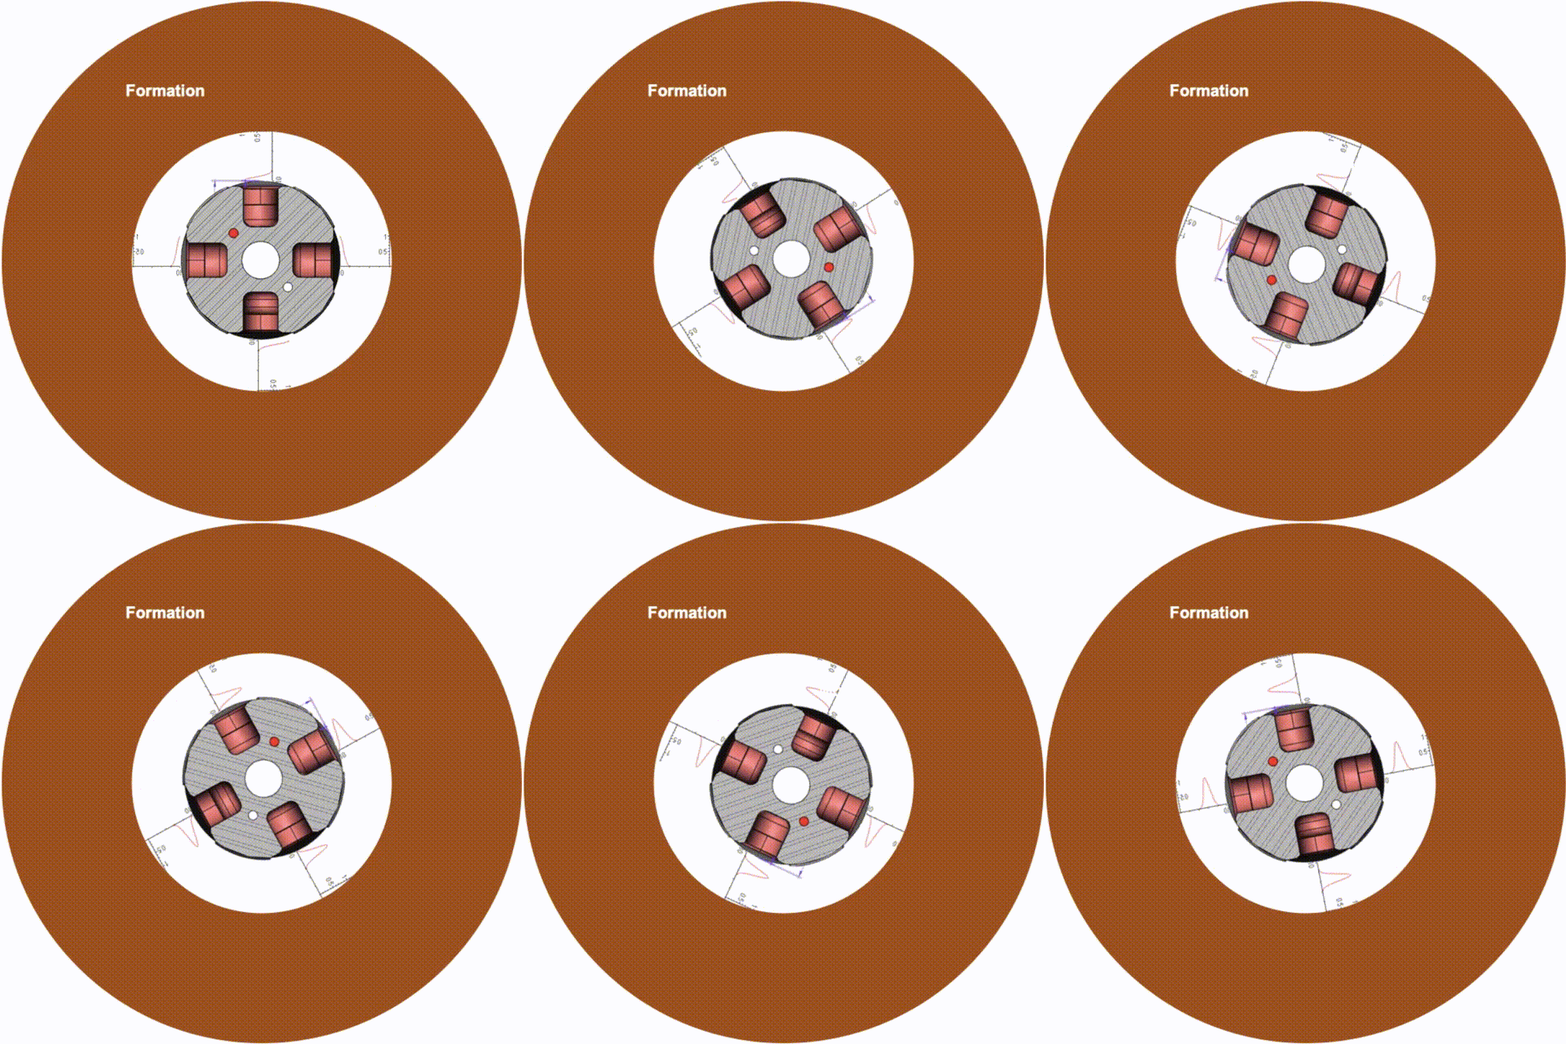
A drilling tool is equipped with four ultrasound transducers positioned 90 degrees apart from each other. Each transducer acts as both a transmitter and receiver. This mode is commonly called the "pulse-echo" mode.
With the tool drilling, all four azimuthally distributed transducers are simultaneously generating ultrasonic pulses and recording the echoes continuously after firing. Each firing data represents a raw waveform reflected from a formation/ borehole surface.


Overview
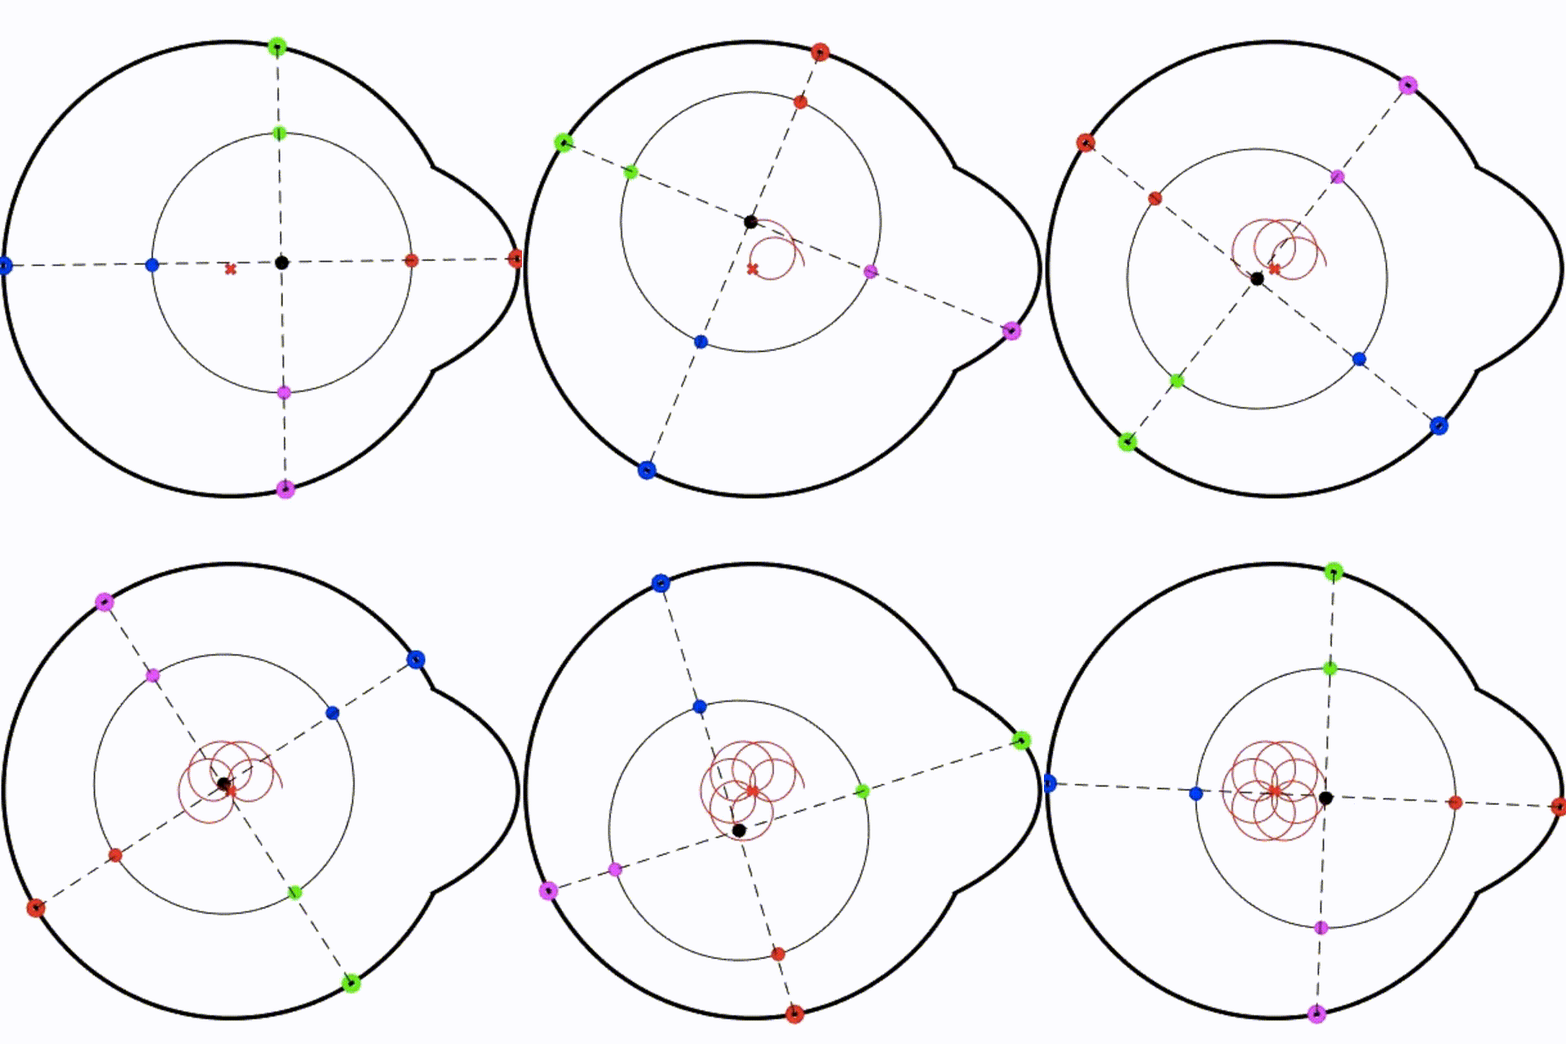
The diagram below illustrates a flowchart from a drilling system with a tool rotating in a borehole to the system output of borehole images on radius and impedance. Here, the borehole is set to the shape of a keyseat (one-side breakout), but it can be any irregular shape in practice. The tool movement is set to the "flower" pattern, aimed to mimic the possible tool motion when drilling thousands of feet underneath the ground. Four transducers and their respective hitting points at the borehole surface are marked in color (red, green, blue, and magenta).
For each tool revolution, rotating from 0 to 360 degrees, tuns of raw waveforms are acquired. The first challenge is how to effectively remove the unwanted ringing noise from the raw data and the next is how to detect the wanted echoes and extract the corresponding travel time and amplitude values. Then, the standoff distances from the tool surface to the borehole surface can be calculated by a simple multiplication of travel time and echo velocity. However, echo velocity is not constant because of the change in environmental factors (e.g., temperature, pressure, mud weight, etc.). Besides, tool motion, tool eccentricity, and mud attenuation also increase the difficulties in generating both borehole caliper and amplitude images.
Our algorithms are capable of effectively overcoming the obstacles described above and also are robust to various drilling scenarios if set properly. Please feel free to check out the patents we have published for more details.


Tool Motion Reconstruction
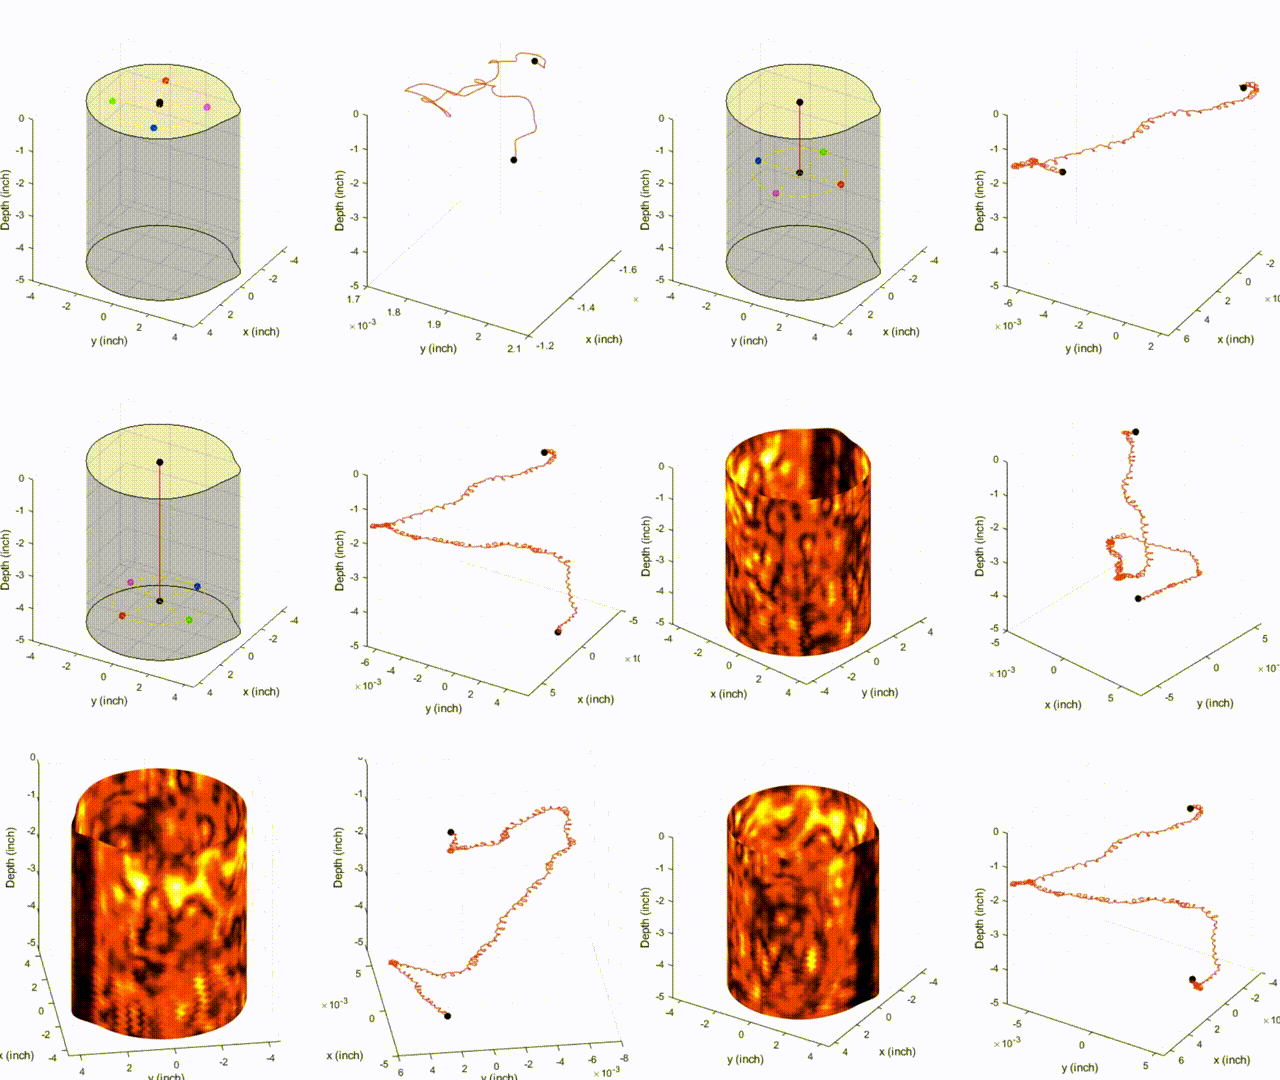
The video below presents a demo of tool movement trajectory reconstruction in 3D, followed by an amplitude image, which can visualize surface features on a borehole. Besides, as can be seen from the left figure, the borehole is not a perfect circle/ ellipse but a keyseat-like shape with a one-side breakout.

Image Correction
Image correction is aimed to compensate for amplitude loss caused by mud attenuation, oblique incidence, and standoff distance and to correct image distortion caused by tool motion, tool eccentricity, and borehole irregularity.
Here, two methods are proposed to correct mud attenuation. The first one is to use static beam patterns, which are transmitting and receiving beam patterns of the transducer, measured in a lab testing environment, as shown in the right two figures, respectively. Then, attenuation maps of the transmitter and receiver can be built by combining the borehole geometry and tool movement information. Lastly, amplitude-corrected images can be calculated by subtracting attenuation maps in the dB domain.
However, static beam patterns may not work once the actual environmental factors differ from the pre-test in the lab environment. A smarter way is to estimate dynamic beam patterns by using real-time amplitude measurements from transducers within a certain period of time. The figure below shows one example of calculated dynamic beam pattern and image comparison before and after image correction. This method is more robust and effective to compensate amplitude loss and remove “artificial” features.


